COVID’s summer signal now starts in wastewater, not the waiting room
CDC’s latest wastewater file shows very low COVID-19 activity at most U.S. sample sites, with small local pockets higher. The useful lesson is to read signals locally and calmly.
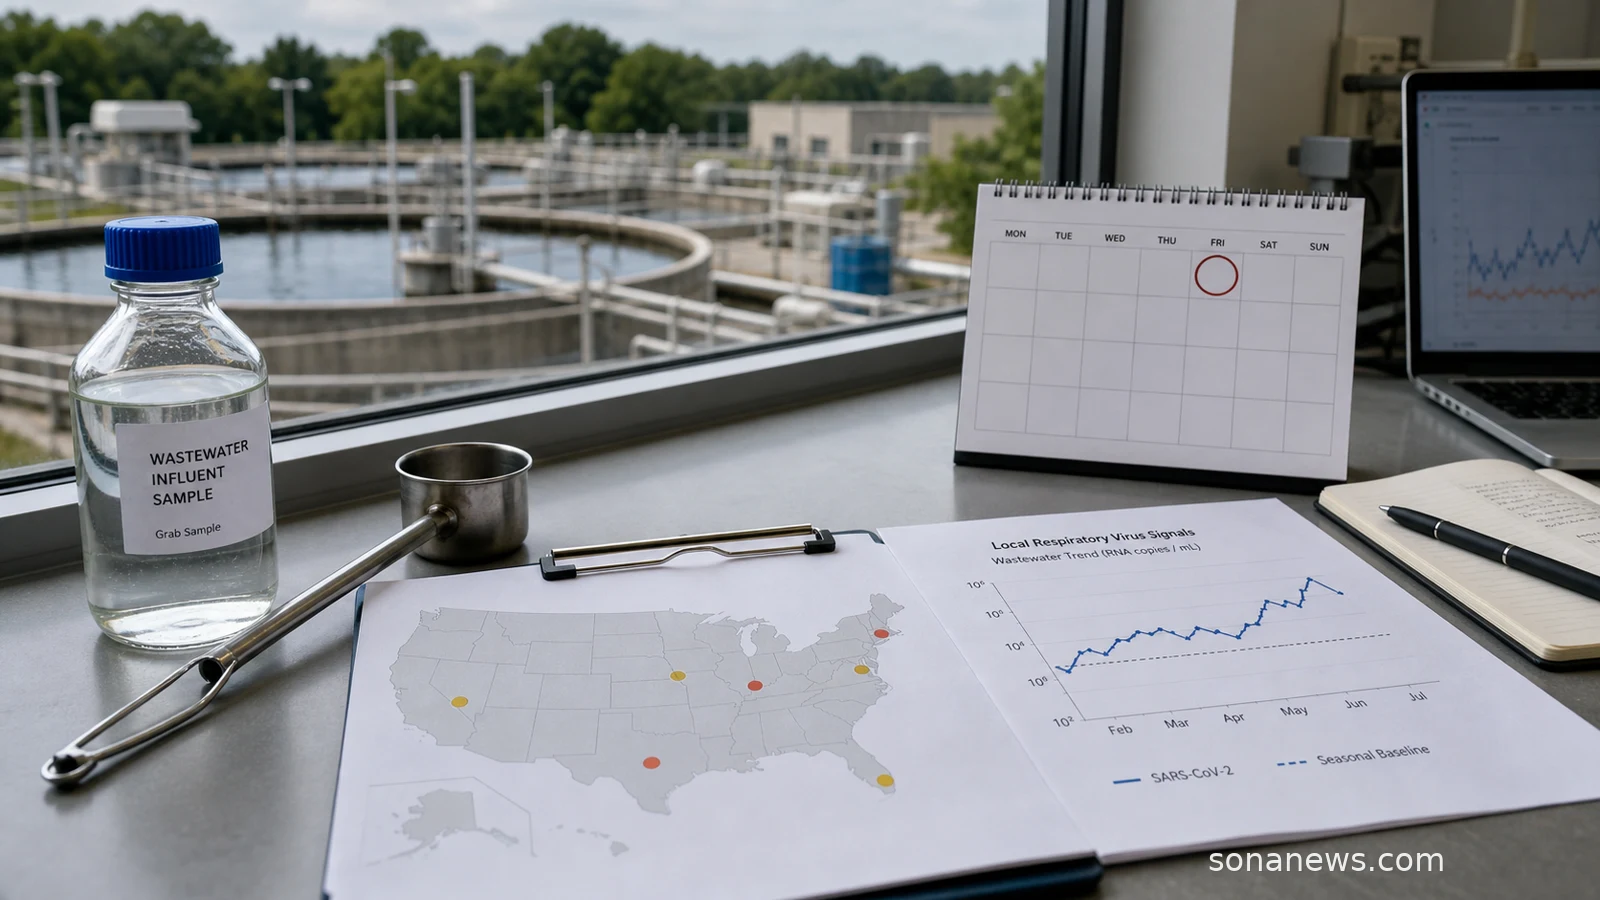

A summer COVID-19 signal no longer has to begin with a crowded waiting room. In the United States, one of the earliest public clues now comes from wastewater: the quiet, unglamorous monitoring of what communities shed before many people test, call a doctor or arrive at hospital.
CDC’s national wastewater page, updated on 22 June, says wastewater monitoring can detect respiratory viruses spreading in a community earlier than clinical testing and before sick people visit a doctor or hospital. It covers SARS-CoV-2, influenza A and RSV, and CDC updates the data every Friday with the previous week’s data after review. The important word is monitoring. A sewer signal is not a personal medical result, and it is not a reason to turn every cough into a headline.
The latest public CSV behind CDC’s wastewater viral activity level dataset, modified on 19 June and covering the week ending 13 June, gives the more useful shape of the story. A Sona News analysis of that official file found 800 SARS-CoV-2 sampling-site records for the week. Of those, 691 were in CDC’s very low category, 56 were low, 35 were moderate, six were high and 12 were very high.
That is not a population-weighted national risk score. It is a site-level snapshot from a changing surveillance network. Some places have many sampling locations, some have limited coverage, and CDC itself warns that data may change as more reports arrive. Still, the pattern is clear enough to avoid two lazy readings. Nationally, the signal does not look like a broad wave in that file. Locally, a handful of places can be meaningfully different from the national mood.
This local-national split is exactly why wastewater has become a more grown-up public-health tool. A national number can reassure, but it can also blur pockets of activity. A local wastewater rise can appear before emergency department visits move, giving health departments a little more time to interpret what is happening. It can also keep public language proportionate: one county’s high signal is not the same as a countrywide emergency.
The rest of CDC’s COVID-19 surveillance page supports that calmer reading. For the week ending 13 June, CDC listed test positivity at 0.8 percent, unchanged from the previous week, and the percentage of emergency department visits diagnosed as COVID-19 at 0.1 percent, also unchanged. The hospitalization rate was 0.2 per 100,000 population. The share of U.S. deaths due to COVID-19 was 0.1 percent for the week ending 6 June. Those are small figures, but they sit beside a warning that the virus has not disappeared.
WHO makes the same point from a global angle. Its 2026 COVID-19 vaccination material says severe disease burden has declined because of widespread immunity from vaccination and past infection, while COVID-19 still causes hospitalizations and deaths, especially among older adults, people with comorbidities, immunocompromised people and pregnant women. WHO’s vaccine-composition statement also notes persistent gaps in case, hospitalization, death and genomic surveillance, which means any neat dashboard reading has limits.
For readers, the practical lesson is mostly about how to read the news. A wastewater spike is an early signal, not a verdict. A low national dashboard does not guarantee every community is low. A high local site does not mean every person in that area is ill. Better public health language sits between these extremes: specific enough to notice local movement, careful enough not to manufacture alarm.
CDC’s prevention guidance for respiratory illnesses keeps that tone. It describes layered, general measures such as staying current with recommended immunizations, hygiene, cleaner indoor air, precautions when sick and extra layers in higher-risk settings. In an article, those points can only be framed as public information, not personal instruction. People’s own risk, vaccination choices, symptoms and medical decisions belong with qualified clinicians and current local public-health guidance.
The bigger change is cultural as much as technical. COVID-19 has moved from a single emergency dashboard into a patchwork of quieter signals: wastewater levels, emergency department percentages, hospital rates, deaths, variant monitoring and vaccine updates. None is perfect alone. Together, they encourage a more local, less theatrical way to follow respiratory-virus season.
That is why the wastewater story is worth watching without making it frightening. The drain is not a doctor, but it can be an early public-health microphone. This June, that microphone is mostly picking up a low national COVID-19 signal, with a few louder local notes. The mature response is not panic or dismissal. It is learning to read the signal at the right scale.
Editorial note. This article is for general public-health information only and is not medical advice. It does not assess any individual symptom, exposure, vaccination decision, test result or clinical risk. People concerned about their health, symptoms or personal risk should use current official public-health information and qualified clinician guidance.
Sources
- Source: "National Wastewater Data for Respiratory Viruses", Centers for Disease Control and Prevention, Extracted 2026-06-24. Verified: CDC tracks SARS-CoV-2, influenza A and RSV in wastewater, updates weekly on Fridays with the previous week’s data, says wastewater can detect community spread before clinical testing or hospital visits, defines WVAL categories and warns data may change
- Source: "CDC Wastewater Viral Activity Level for SARS-CoV-2, Influenza A and RSV", Data.gov and CDC data API, and https://data.cdc.gov/api/views/atcp-73re. Extracted 2026-06-24. Verified: official dataset scope, weekly update cadence, June 19 modification date and CSV download used to count 800 SARS-CoV-2 site records for week ending 2026-06-13, with 691 very low, 56 low, 35 moderate, six high and 12 very high
- Source: "Surveillance and Data Analytics", Centers for Disease Control and Prevention, Extracted 2026-06-24. Verified: CDC’s mid-June COVID-19 indicators, including 0.8 percent test positivity, 0.1 percent emergency department visit diagnosis share, 0.2 hospitalizations per 100,000 and 0.1 percent of deaths due to COVID-19
- Source: "Preventing Respiratory Illnesses", Centers for Disease Control and Prevention, Extracted 2026-06-24. Verified: CDC’s general layered prevention framing for COVID-19, flu and RSV, including immunizations, hygiene, cleaner air, precautions when sick and extra layers in higher-risk settings
- Source: "Immunization, Vaccines and Biologicals: COVID-19", World Health Organization, Extracted 2026-06-24. Verified: WHO’s 2026 framing that severe COVID-19 burden has declined but hospitalizations and deaths continue, especially among higher-risk groups
- Source: "Statement on the antigen composition of COVID-19 vaccines", World Health Organization, Extracted 2026-06-24. Verified: WHO’s May 2026 note on continuing SARS-CoV-2 circulation, surveillance gaps and vaccine-composition monitoring
Help us improve
Was this article useful?
One anonymous tap helps Sona improve future reporting, headlines and source context.
Up next

ECDC says the risk to the wider European public is very low. The useful lesson is how a rare cruise-ship outbreak becomes a weeks-long contact list.
Continue readingMore in Health