The healthy-diet price is mostly built after the farm gate
The UN’s SOFI 2026 report says global hunger fell again, yet 2.69 billion people could not afford a healthy diet. Its cost measure points beyond the farm to storage, transport and markets.
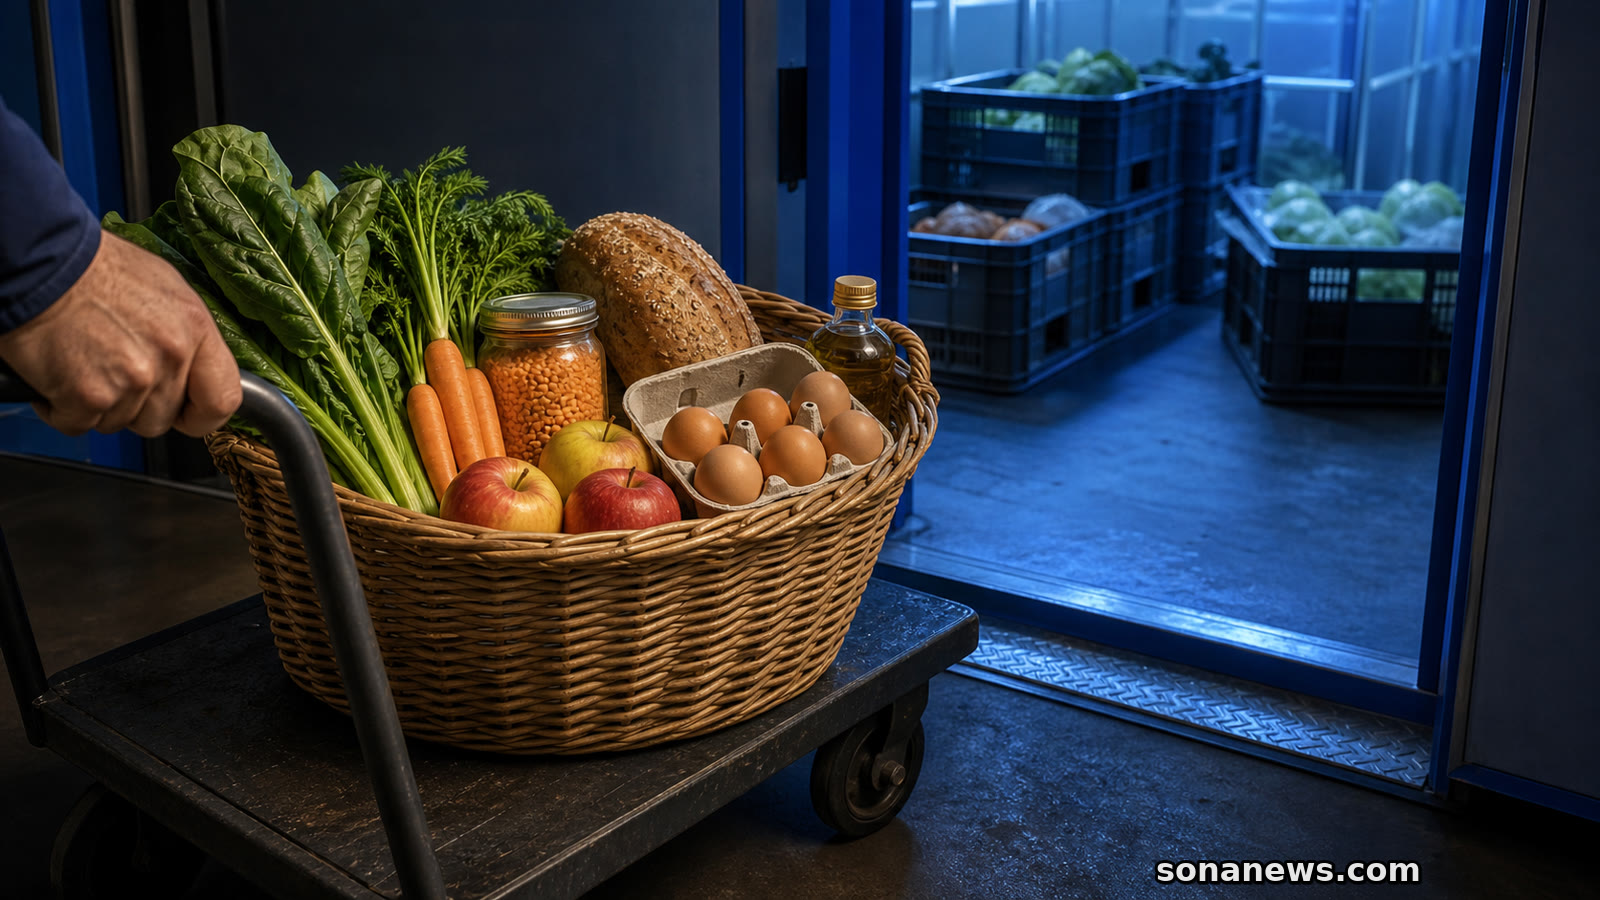

A basket of nutritious food does not arrive at a market by agricultural output alone. Perishable produce may need sorting, cooling, storage and transport. Goods pass through processors, wholesalers and retailers. By the time the basket reaches a buyer, much of its cost has been built beyond the farm.
That is the most useful shift in *The State of Food Security and Nutrition in the World 2026*, released on 21 July by the Food and Agriculture Organization, the International Fund for Agricultural Development, UNICEF, the World Food Programme and the World Health Organization. The annual report, known as SOFI, records a third consecutive year of declining global hunger. It also asks why a healthy diet remains economically out of reach for nearly one person in three.
Those findings belong together, but they are not the same statistic. SOFI estimates that 645 million people, or 7.8 percent of the world’s population, faced hunger in 2025. That was down from 659 million in 2024 and 688 million in 2022. A broader measure found that 2.1 billion people experienced moderate or severe food insecurity in 2025, meaning that they sometimes compromised the quality or quantity of what they ate.
The report’s affordability measure tells a third story. It estimates that 2.69 billion people, 32.7 percent of the global population, could not afford a healthy diet in 2025. That number had fallen from 2.97 billion in 2021, even as the average global cost of the benchmark diet rose from 3.44 to 4.28 purchasing power parity dollars per person per day over the same period.
A purchasing power parity dollar is a comparison unit, not a universal till price and not an amount to convert directly using a tourist exchange rate. The healthy-diet cost is also not a personal meal plan. FAO constructs a benchmark basket from the least expensive locally available foods that can provide energy and most nutrient requirements across six groups: starchy staples; animal-source foods; legumes, nuts and seeds; fruits; vegetables; and oils and fats. The basket targets 2,330 kilocalories a day for measurement purposes.
That method makes comparison possible, but it does not say what a particular person should eat. Individual needs, culture, locally available foods and dietary customs differ. WHO describes healthy diets through adequacy, balance, moderation and diversity, while stressing that their exact composition varies. SOFI’s indicator is designed to track economic access at population level, not to assess personal nutrition or judge a household’s shopping.
The report’s sharper contribution is to look along the value chain. Its joint release says activities after the farm gate account for 70 to 75 percent of what consumers pay, with processing, logistics and wholesale responsible for up to 40 percent of the total. That means a discussion framed only around farm production can miss the roads, cold rooms, storage losses, border delays, market competition and retail systems that shape the final price.
Perishable, nutrient-rich foods make that infrastructure visible. Grain or tubers can supply relatively inexpensive energy and survive longer storage. Fruit, vegetables and some animal-source foods may depend more heavily on cooling, careful handling and rapid transport. A weak cold chain can therefore raise costs or losses precisely where dietary diversity depends on products reaching markets in usable condition.
The pattern is not identical everywhere. SOFI says Latin America and the Caribbean had the highest average healthy-diet cost in 2025, at 4.91 purchasing power parity dollars per person per day. Vegetables formed the largest cost share there. In Africa, animal-source foods were the largest contributor, and 66.6 percent of the population could not afford the benchmark diet. Landlocked developing countries face another structural disadvantage: FAO’s interactive report says import logistics costs can be 79 percent higher than in coastal countries in the same region.
Those differences are why there is no single global price fix. Irrigation, roads, cold storage, research, trade facilitation, competition rules and reduced food loss may matter in different combinations. The report also argues that broad subsidies aimed at the cheapest staples may lower calories without making a diverse diet much more attainable. Policy has to respond to the food groups and value-chain bottlenecks that drive cost in a particular place.
Affordability is only one part of nutrition. Lower prices do not ensure that suitable food is available, safe, culturally acceptable or chosen. Income, conflict, displacement, marketing, public services and household conditions all shape diets. The report notes that progress on major nutrition targets remains slow, with adult obesity rising, anaemia among women aged 15 to 49 worsening and only 30.8 percent of children aged 6 to 23 months receiving a minimally diverse diet.
Nor should the modest improvement in global hunger be flattened into a victory headline. Africa had about 309 million hungry people in 2025, more than Asia’s 292 million, even as its rate showed the first sign of stabilising after years of increase. The agencies also warn that conflict, weather extremes and cuts to development and humanitarian funding could undo progress. A global average can move in the right direction while regional gaps widen.
The healthy-diet basket is therefore less a shopping list than a test of the systems behind the shelf. It asks whether nutritious foods can move from production through storage, transport and markets at a price people can reach. SOFI’s answer is not simply that food is too expensive. It is that the route from farm to table is part of public health.
Editorial note. This article is for general public-health and nutrition-policy information only. It is not medical, dietary, financial or food-safety advice and does not assess any individual’s diet, health, nutritional status, income or food needs. Personal nutrition or medical questions belong with appropriately qualified local health professionals and current public-health guidance.
Sources
- Source: FAO, IFAD, UNICEF, WFP and WHO, “UN report: Global hunger levels ease for third consecutive year as regional disparities persist”, Published and extracted 21 July 2026. Verified: 2025 hunger and food-insecurity estimates; regional disparities; nutrition indicators; healthy-diet cost and affordability figures; value-chain cost shares; policy framing and current uncertainty
- Source: World Health Organization, “The State of Food Security and Nutrition in the World 2026”, Published and extracted 21 July 2026. Verified: joint authorship, report scope, 249-page status, 2026 focus on structural drivers of healthy-diet costs and the distinction between modest global improvement and persistent inequality
- Source: Food and Agriculture Organization, “The cost of a healthy diet: A number with a story to tell”, Extracted 21 July 2026. Verified: six-group Healthy Diet Basket method, 2,330-kilocalorie measurement target, population-monitoring purpose, regional cost drivers, landlocked-country logistics comparison and post-farmgate policy levers
- Source: Food and Agriculture Organization, “The State of Food Security and Nutrition in the World”, Updated and extracted 21 July 2026. Verified: flagship-report status, estimated 645 million people facing hunger and about 2.7 billion unable to afford a healthy diet in 2025, plus links to the full report and official data resources
- Source: World Health Organization, “Healthy diet”, Updated 26 January 2026; extracted 21 July 2026. Verified: adequacy, balance, moderation and diversity principles; variation by individual characteristics, culture and locally available foods; links between prices, food systems and healthy food environments
- Source: UNICEF, “UN report: Global hunger levels ease for third consecutive year as regional disparities persist”, Published 21 July 2026; extracted 21 July 2026. Verified: cross-agency release text, regional detail, affordability figures, nutrition-target context and the policy emphasis on food, health, education and social protection
Help us improve
Was this article useful?
One anonymous tap helps Sona improve future reporting, headlines and source context.
Up next

US and UK health guidance makes the same distinction: alcohol hand gel has a role in everyday hygiene, but it is not a substitute for handwashing against norovirus.
Continue readingMore in Health