Saturn’s new south-pole decagon is still taking shape
Hubble data trace a 10-sided atmospheric wave from faint 2023 hints to a clearer 2025 pattern. Its slow drift and 32-day wobble do not yet explain why it formed.
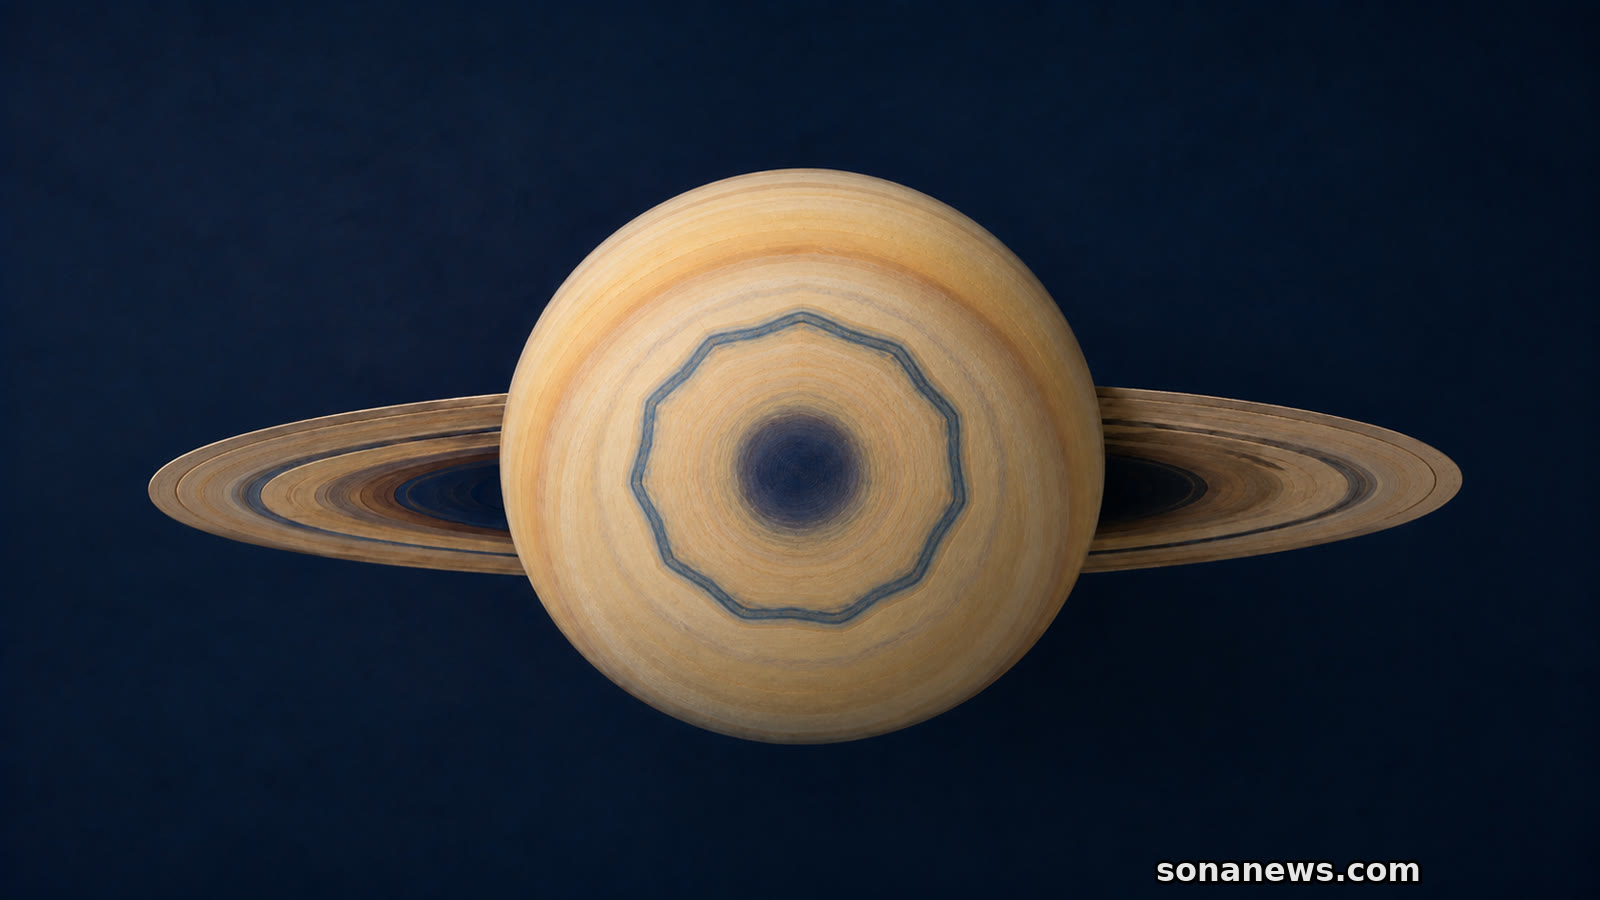

Saturn’s south pole now has a polygon of its own, but “decagon” can give the wrong mental picture. Hubble and ground-based observations do not show a rigid 10-sided object fixed above the planet. They show an enormous wave folded into a fast atmospheric jet, with ten vertices that drift and wobble.
That distinction is the most useful part of the new result. A study published online in Science Advances on 2 September reports the first large, regular-sided jet pattern identified in Saturn’s southern hemisphere. The wave lies at roughly 58 to 63 degrees south. It was clear in 2025 images, while earlier Hubble data show weaker signs in 2023 and 2024.
The geometry is striking. The motion is more revealing. The decagon travels east at about 2.5 metres per second relative to Saturn’s standard radio-rotation reference, while the eastward jet near 60.5 degrees south reaches about 116 metres per second. Its vertices also oscillate in longitude over an average period of 32 days.
Those measurements make the feature a moving atmospheric problem, not a southern copy of Saturn’s famous northern hexagon.
The discovery joins professional and amateur observing rather than beginning with a single telescope exposure. Agustín Sánchez-Lavega and amateur astronomers Trevor Barry and Jean-Paul Oger noticed a subtle undulating band in ground-based Saturn images from 2024. The signal appeared stronger in 2025.
Researchers then used Hubble’s Outer Planet Atmospheres Legacy programme, or OPAL, to test the pattern with sharper observations across full rotations of Saturn. Archival Hubble images pushed the visible history back to 2023. In those earlier frames, the study found weaker brightness contrasts at the vertices and less emphatic straight sides.
That sequence matters because “new” has two possible meanings. The decagon is newly reported, and the evidence suggests it has become more pronounced. It does not provide a precise birth date. Saturn’s changing seasons have also made the southern pole easier to observe from Earth, so improved visibility and physical evolution have to be separated carefully.
NASA’s account says researchers had looked for a southern counterpart since 1990, while Cassini observations from 2004 to 2017 showed no sign of a comparable long-lived formation. The current evidence therefore supports an evolving feature that was present by 2023, not a claim that it appeared on one known day.
The two speeds in the study describe different things. The roughly 116-metre-per-second value belongs to the zonal jet, the dominant east-west atmospheric flow. The much smaller 2.5-metre-per-second value tracks the decagon’s motion against Saturn’s reference rotation.
A reader should not treat the slower number as the wind speed inside the shape. It is the measured movement of the pattern. Waves can propagate through a moving fluid at a speed different from the material flowing through them, just as a visible bend can move along a rope without carrying the whole rope at that speed.
The vertices are not fixed fence posts either. Their longitudes swing around the mean motion, with measured amplitudes of about 4.6 to 8.4 degrees and an average 32-day period. The 10-sided outline is therefore a changing organisation of flow.
Hubble adds a vertical clue. Different filters sample different levels of Saturn’s atmosphere, and the decagon’s apparent position shifts slightly with wavelength. NASA and ESA describe the feature as extending through multiple atmospheric layers, rather than being only a colour boundary at one cloud top.
That wavelength shift should be interpreted cautiously. It does not mean the entire polygon jumps between positions from one instant to the next. Different bands of light make different heights and particles more or less visible, so the contour used to locate a wave can move slightly. Finding related geometry at those levels supports vertical extent, but it does not yet provide a complete three-dimensional map of the flow.
The official Hubble graphics contain another important caveat. A dashed circle and an “X” mark the innermost south-polar area where Hubble did not capture data. The decagon is traced in the surrounding atmosphere; the missing centre should not be mistaken for a measured dark hole, an eye or evidence about the mechanism. That visual limitation is one reason the outline and its motion carry more scientific weight than the appearance of the pole’s centre.
The authors interpret the decagon as a possible large-scale meandering wave that is trapped vertically and confined north to south by the curvature of the jet. Their shallow-water simulations produce two candidate routes. A spatially repeating disturbance along the jet peak could organise the polygon, or a dark anticyclonic vortex just north of it could help drive the wave.
Both ideas are model-supported possibilities. Neither is a confirmed origin story. The observations establish the shape, latitude range, motion, oscillation and multi-level signature more securely than they establish the trigger.
This is also why the northern hexagon is a useful comparison but a poor template. Saturn’s six-sided northern wave has been observed for more than 40 years and is nearly stationary in the relevant rotating frame. The southern feature has ten sides, moves east and appears to be strengthening. Shared polygonal geometry does not require identical dynamics or longevity.
Laboratory and numerical fluid experiments have long shown that rotating flows can organise into several polygonal forms under different conditions. Counting sides identifies a pattern to explain. It does not by itself identify the mechanism.
Hubble supplied the resolution, but repeated coverage supplied the discovery. A single 2025 image could reveal a decagon. It could not show that the vertices were fainter two years earlier, that the pattern was changing, or that its motion differed so sharply from the jet carrying it.
The observing sequence also guards against mistaking one arrangement of clouds for a planet-scale polygon. Hubble can follow full rotations without the atmospheric blur introduced by observing through Earth’s air, while many ground-based images add coverage across dates and viewing conditions. Researchers could then ask whether the same sequence of straight segments and vertices returned at consistent latitudes and how its phase changed. Looking back after the 2025 shape became obvious does create a risk of seeing weak patterns in noise, so the earlier frames are best treated as subtler evidence of evolution, not as equally crisp detections.
OPAL was designed to provide this kind of annual baseline for the outer planets. Ground observers filled the intervals and first drew attention to the southern wave. The result is a practical example of how an archive can become part of an instrument: old frames acquire new value once a later pattern tells scientists what to measure.
The next tests are straightforward to state and difficult to complete. Hubble can show whether the vertices strengthen, fade or change their drift. Webb can probe the atmosphere at infrared wavelengths and different depths. Models have to reproduce the observed side count, slow phase motion, 32-day oscillation and vertical reach at the same time.
If the decagon settles into a durable configuration, Saturn will have two distinct natural laboratories for polygonal jets. If it fades, the record from 2023 onward will still capture the development of a rare large-scale wave. Either outcome is more informative than the shape alone.
Sources
- Sánchez-Lavega et al., “A decagon wave around Saturn’s south pole,” Science Advances. Published online 2 September 2026. Verified: latitude range, 2023 to 2025 evolution, 2.5 and 116 metre-per-second motions, 32-day oscillation, amplitude range, vertical confinement interpretation and two model-supported candidate triggers
- NASA Hubble, Hubble Tracks New Decagon Encircling Saturn’s South Pole. Published 2 September 2026. Verified: discovery status, OPAL and ground-observer sequence, archival confirmation, lack of a comparable Cassini feature, multiwavelength depth clue and planned Hubble/Webb follow-up
- ESA/Hubble, Decagon on Saturn’s south pole, single-filter image. Released 2 September 2026. Verified: single-filter visual description, approximate 63-degree-south location, wavelength-dependent apparent position and the distinction between captured data and the marked central data gap in the official release image
- NASA Cassini, Saturn’s Perplexing Hexagon. Verified: the northern hexagon’s observation history, jet-wave interpretation, long persistence and the wider fluid-dynamics context for naturally occurring polygonal flows
- Europlanet Science Congress 2026 abstract, A Decagon Wave around Saturn’s South Pole. Updated 2 July 2026. Verified: independent public abstract record of the measured latitude, phase speed, jet speed, vertex oscillation and interpretation as a vertically trapped, meridionally confined wave
Help us improve
Was this article useful?
One anonymous tap helps Sona improve future reporting, headlines and source context.
Up next
The mission plans to bring material from Phobos to Earth in 2031. Its sample, paired with measurements from space, could help explain where Mars's moons came from.
Continue readingMore in Space