A 5.6-trillion-pixel sky map still needs spectra to become 3D
DESI Legacy Surveys DR11 records where almost four billion sources appear and how bright they look. For DESI's high-resolution 3D map, spectroscopy supplies the distance layer.

The largest number attached to the new DESI Legacy Imaging Surveys release is 5.6 trillion pixels. The more useful distinction is one dimension.
Data Release 11, announced on 10 August, is a vast two-dimensional atlas of the sky. It records where astronomical sources appear and how bright they look in visible and near-infrared bands. It does not, by itself, turn each point into a precise position through cosmic depth. For the Dark Energy Spectroscopic Instrument's high-resolution three-dimensional map, that next coordinate comes from measuring how an object's light is spread across wavelengths.
That division of labour explains why a map containing nearly four billion sources can be the foundation for a spectroscopic survey that has observed tens of millions of galaxies and quasars. Imaging finds and characterises the candidates. Spectroscopy takes the slower, more selective measurement needed to infer distance.
The DR11 release combines 263,407 telescope exposures collected across 2,285 nights. Its ground-based ingredients include the Dark Energy Camera Legacy Survey with DECam on the Blanco 4-metre telescope in Chile, the Mayall z-band Legacy Survey at Kitt Peak in Arizona, and the Beijing-Arizona Sky Survey with the Bok telescope. Years of infrared observations from NASA's WISE and NEOWISE missions supplement the optical data.
NOIRLab and Berkeley Lab describe the resulting atlas as covering roughly 75 per cent of the sky. That compact figure needs a little care. Coverage is not identical in every filter or at every depth. The DR11 technical description reports more than 30,000 square degrees with at least one pass in some individual optical bands, but 22,731 square degrees with at least one pass in all four g, r, i and z bands together. The northern region also does not gain the i-band data available in the south.
DR11 is therefore better understood as a large, consistently processed inference model than as one uniform camera exposure. The southern footprint incorporates new DECam imaging, including observations taken between 2013 and 2024. The northern part uses reprocessed material already present in an earlier release.
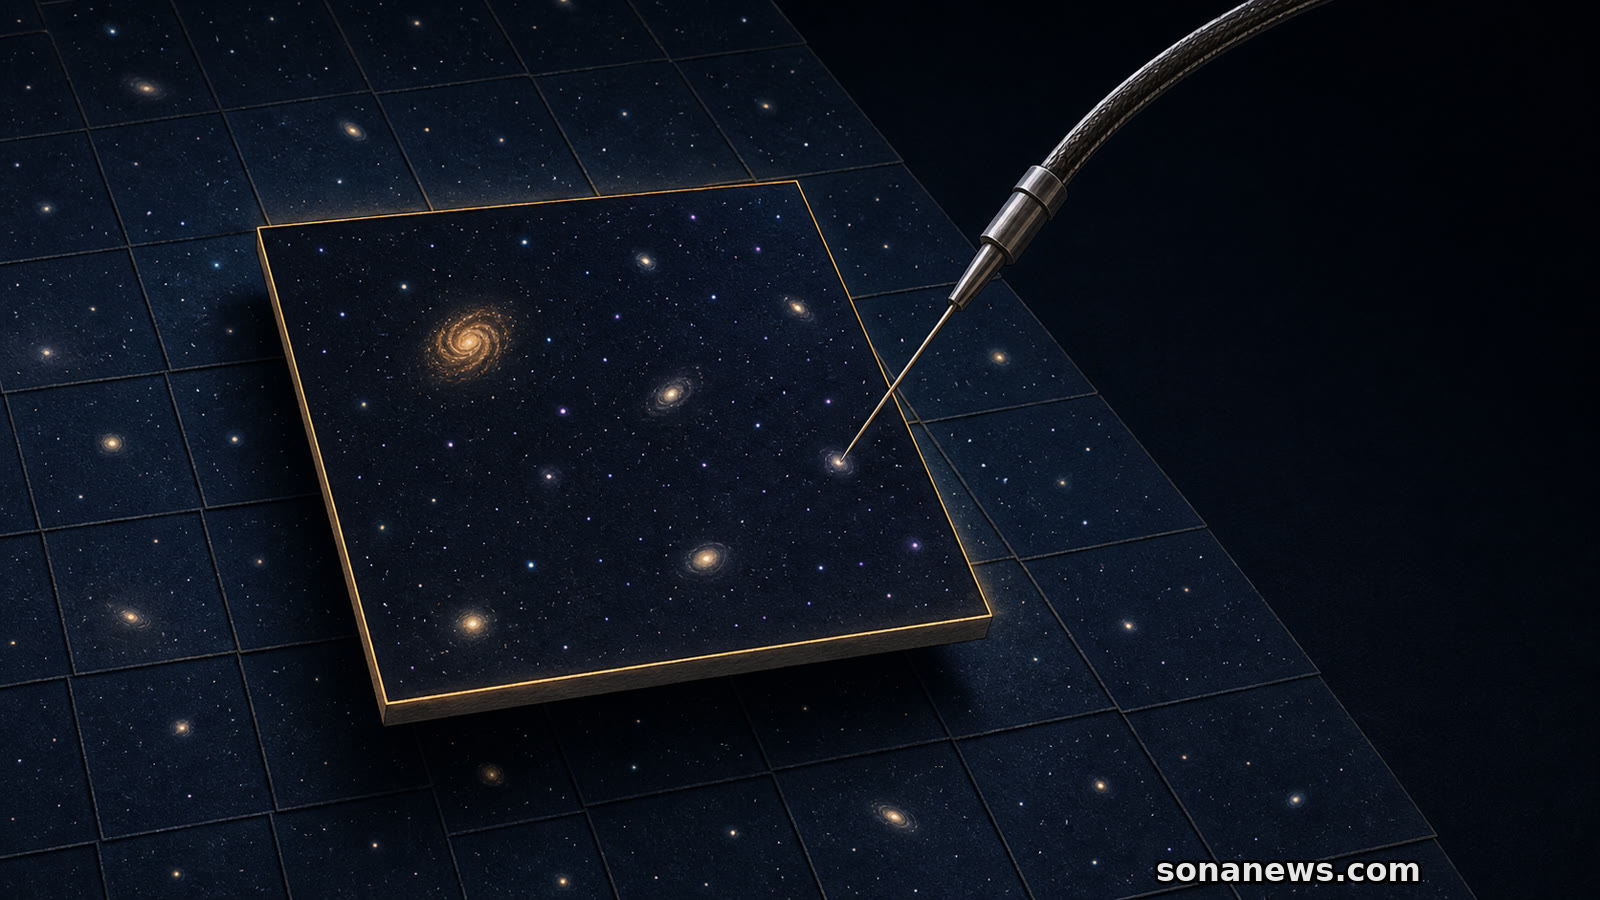
The public products are divided into sky "bricks" about a quarter of a degree on each side. DR11 defines 662,174 bricks across its geometry, with about 3.9 billion unique sources distributed over 517,550 unique bricks. Images, models and catalogues can be explored through the Legacy Survey viewer and accessed through project and NOIRLab data services.
An imaging survey can measure position on the sky, apparent shape and brightness through selected filters. Colour differences between filters also contain information about an object's likely type and distance. Those estimates are valuable, but DESI's precision cosmology relies on spectra.
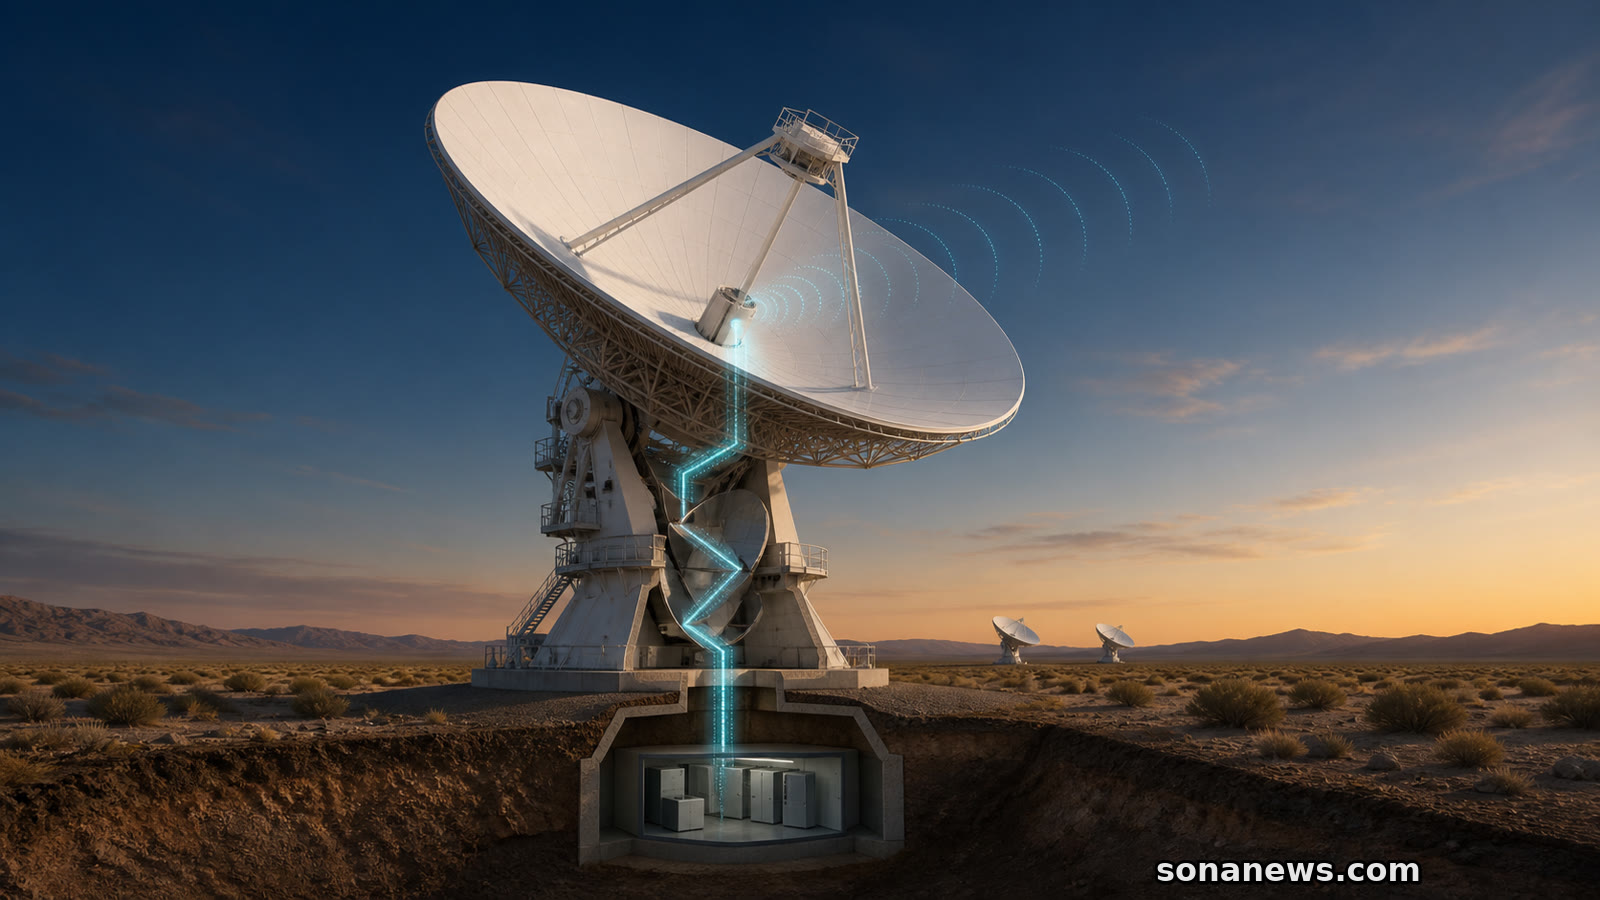
DESI uses 5,000 robotically positioned optical fibres on the Mayall telescope. A fibre gathers light from a selected target and sends it to spectrographs, which separate that light by wavelength. Astronomers identify familiar spectral features and measure how far those features have shifted towards longer wavelengths as the Universe expanded. That redshift supplies the radial coordinate used to place a galaxy or quasar into the three-dimensional map.
The imaging atlas and the spectroscopic map should not be treated as rival products. One solves the selection problem: which faint points are promising galaxies, quasars or other targets, and where are they? The other adds the wavelength measurement that makes a high-resolution depth map possible.
This also explains an apparent mismatch in scale. The April 2026 DESI milestone covered more than 47 million galaxies and quasars, plus 20 million stars. DR11 contains nearly four billion sources, primarily stars and galaxies, because wide-field imaging can register far more objects than a fibre instrument can observe spectroscopically in a finite survey.
The Legacy Surveys were created to support DESI, but DR11 is not the analysis of DESI's completed five-year dataset. It is an imaging release and reference layer. Berkeley Lab says the expanded map has been used to select DESI targets since June 2026 and will guide continuing observations.
DESI finished the observations planned for its original five-year survey in April and is continuing into 2028. Analyses of its first three years have strengthened hints that dark energy may change over time. A hint is not a confirmation, and the improved dark-energy results based on the full five-year dataset are expected in 2027.
That timeline matters because the language of "mapping the Universe" can collapse several stages into one. A camera exposure is not a catalogue. A catalogue is not a spectrum. A collection of spectra is not yet a tested cosmological result. Each layer depends on calibration, modelling and checks that are less visible than the finished visualisations.
For a reader opening the Legacy Survey viewer, the immediate reward is visual. One can move from a broad field to individual galaxies, compare imaging layers and inspect places that other surveys may revisit. Researchers can use the same reference to look for uncommon objects, plan observations and compare changes over time.
The viewer cannot make the depth dimension obvious from appearance alone. A small red object might be distant, intrinsically red, affected by dust or some combination of these. Images narrow the possibilities. Spectra provide the more direct wavelength evidence that DESI needs for its map.
The 5.6-trillion-pixel headline is justified as a statement of scale. The scientific story is the handoff. DR11 makes an enormous field of possible targets visible and searchable. DESI then asks a much narrower question of selected points: not only where and how bright, but how far away.
Sources
- NSF NOIRLab: Scientists Release Biggest 2D Map of the Universe. Published 10 August 2026. Verified the release date, 5.6-trillion-pixel scale, nearly four billion objects, rough 75 per cent sky coverage, 263,407 exposures, contributing surveys, public access, imaging-to-spectroscopy distinction and relationship to DESI
- DESI Legacy Surveys: Data Release 11 description. Verified DR11's status as the eleventh public release, regional and filter limits, observation dates, source count, brick geometry, imaging products and technical distinction between stacks and the inference pipeline
- Lawrence Berkeley National Laboratory: Scientists Release Biggest 2D Map of the Universe. Published 10 August 2026. Verified 2,285 observing nights, processing context, WISE supplementation, target use since June 2026 and the role of the atlas in continuing DESI operations
- NSF NOIRLab: DESI Completes Planned 3D Map of the Universe and Continues Exploring. Published 15 April 2026. Verified the 5,000 fibre-optic positioners, more than 47 million galaxies and quasars, 20 million stars, continuing observations through 2028, provisional dark-energy language and expected 2027 full-survey results
Help us improve
Was this article useful?
One anonymous tap helps Sona improve future reporting, headlines and source context.
Up next
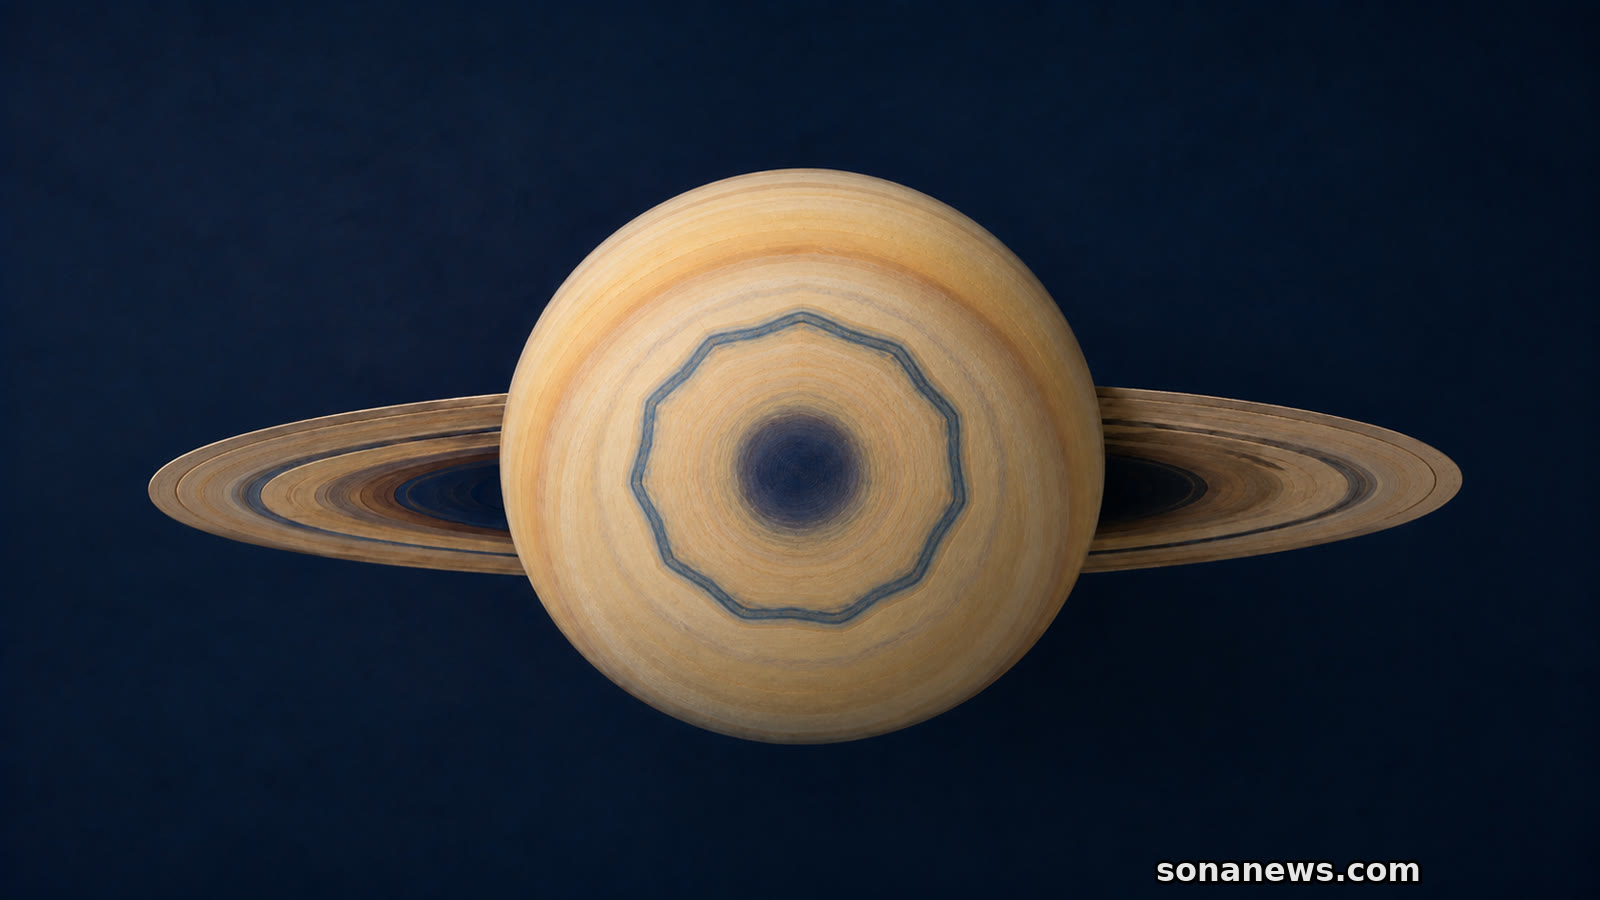
Hubble data trace a 10-sided atmospheric wave from faint 2023 hints to a clearer 2025 pattern. Its slow drift and 32-day wobble do not yet explain why it formed.
Continue readingMore in Space